Decisions in the dark
Manual reports arrive late and do not reconcile across teams.
Launch program · limited availability
Microsoft Fabric · Power BI · AI
Reporting and automation for your business: we bring your spreadsheets and systems together into reports that update themselves.
What were CLIENTE-A's official sales in March?
Answer
S/ 2,996.24
Official sales · March 2026 · before VAT
In your dashboardS/ 2,996.24✓ same figure
See figure, filters and evidence →The problem
Manual reports arrive late and do not reconcile across teams.
Months of project work and a large budget before the first result. We show you yours in 5 business days.
Someone built it by hand. If they leave or the system changes, nobody knows how to update it.
Where to start
For companies with 50 to 500 employees already using Microsoft 365, Azure, or Power BI.
Your first dashboard at no cost, built on your numbers. When you want more pages, sources, or automatic refresh, we continue with Power BI Express.
The complete platform: ingestion, history, and verified data quality. Power BI lives inside it.
Talk to your data in your own words and automate repetitive work.
How it works
Your first dashboard in 5 business days.
Your case and sources
We test one report
Proposal and price
Optional support
No obligation to hire after the pilot
On paid projects: scope and price in writing · the final payment is released once we validate together · 12 months of support
The clock starts once we have access to your data.
We build the system behind it: organized data, one definition for every KPI, and an experience your team can operate.
We do it with our own system of AI agents that helps us automate analysis, engineering, modeling, and validation tasks. Every delivery keeps technical review and acceptance criteria defined with your business.
Microsoft Fabric
ERP, SQL, files, and APIs flow into a platform with history, quality rules, and layers designed to grow.
Semantic model
Sales, margin, and customers mean the same thing to Finance, Sales, and Operations. The model holds the rules; the report explains them.
Power BI + Fabric Apps
We design every view around a decision: what changed, why it matters, and where to act now.
Governance and operations
Access, testing, and deployments are part of the product. Your team receives code, documentation, and a clear way to maintain it.
Chat on your model
It answers with the same rules and figures as your dashboard, and shows where each answer came from so you can check it.
Talk to your data
It answers with the same rules and figures as your dashboard, and shows where each answer came from so you can check it.
Add it to any plan; it comes included in the Full platform.
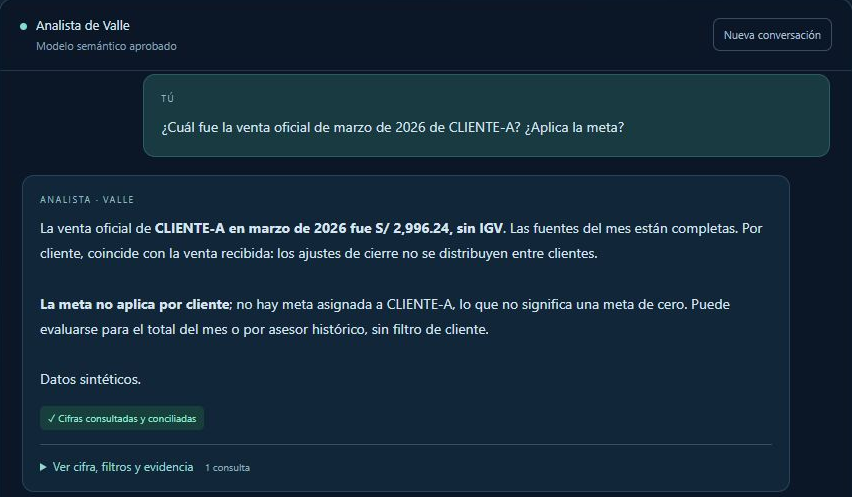
Example with simulated data from a fictitious distributor.
The impact
Sales, operations, and finance reports. Explore the examples and let’s talk about the report your team needs.
Is your team still preparing these reports by hand?
Let’s talk about your report

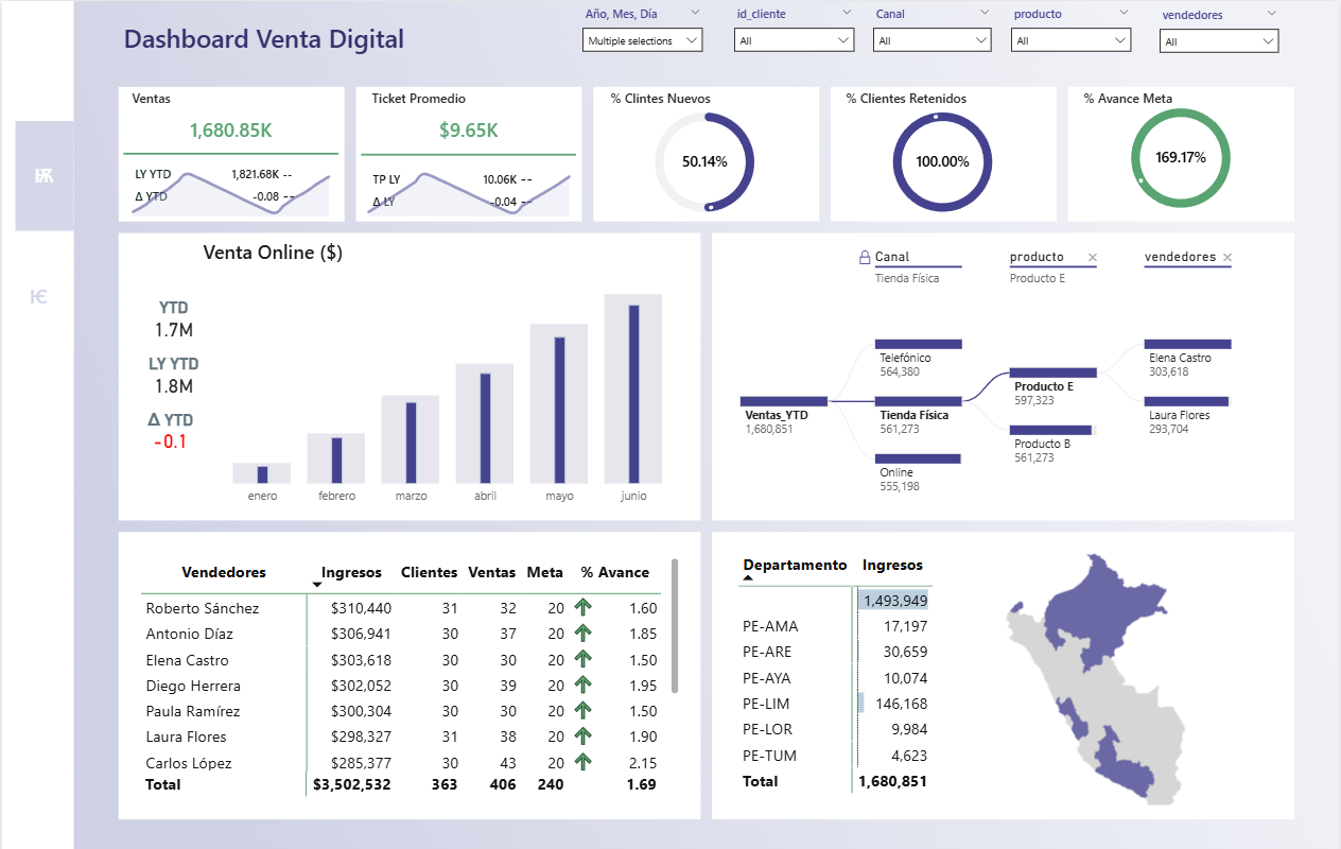


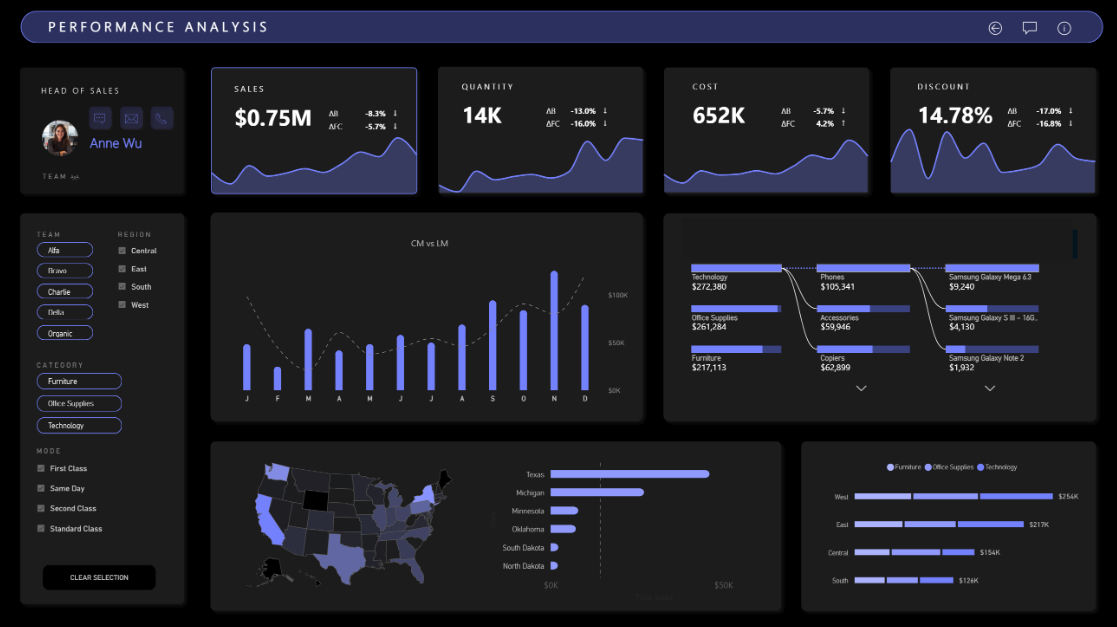
The figures below are reference targets, not client results or guarantees: we agree on them with you during discovery.
Free diagnostic · 4 minutes
17 questions and an 11-page guide for your stage: what staying there costs you and the 4 moves to reach the next one.
Next step
Tell us about your use case. We reply within 24–48 hours.
Prefer to email us directly? eduardo@eduardoportaro.com